

POWER QUALITY CASE STUDY
Separating the billing opportunity from the value of local correction, electrical capacity and coordinated source control.
ASSESSMENT
LOAD CENTRES
BILLING-EVENT PF
PROJECT STATUS
PROJECT OVERVIEW
In a real Zamori industrial project, several load centres showed scope for power-factor correction. The billing analysis revealed a more specific finding: the reported monthly maximum-demand events already occurred at near-unity power factor.
That meant a correction system could have engineering value without producing a large immediate demand-charge saving. Zamori's assessment separated the utility account, internal electrical capacity and coordination of generators, solar and battery storage.
This is a focused companion to our whole-plant energy optimisation case study. Both articles describe work from the same industrial project.
STUDY CONTEXT
Based on Zamori's project report, “Power Factor Correction: Client Findings, Technical Motivation and Business Case”. The client, site and commercial details are anonymised. The findings describe an engineering assessment, rather than verified post-installation savings.
Zamori Engineering Services
September 2026
ASSESSMENT PRIORITIES
01
Local load-centre conditions differed materially, so a single plant average was insufficient.
02
The largest reactive-power requirement occurred infrequently; recurring duty needed separate consideration.
03
The power-factor-only recalculation produced very little change in reported monthly maximum demand.
04
Generator operation changed the reactive-power balance seen at the utility connection.
05
Final equipment selection required harmonic measurements, a motor-drive inventory and verified generator and inverter capabilities.
ENGINEERING STUDY / 01
Power factor relates useful active power, measured in kilowatts, to the apparent power the system carries, measured in kilovolt-amperes. A low power factor can require more electrical capacity for the same useful output.
The account reviewed for this project included active-energy and maximum-demand charges. No separate reactive-power or reactive-energy penalty was identified in that account. Those are project-specific findings; another owner's tariff and billing rules would need their own assessment.
The reported demand series also showed that its maximum-demand events already occurred at power factors of approximately 0.992–0.996. Recalculating the series at a 0.995 target left almost all periods unchanged. One period changed by approximately 0.32%.

The report compares existing monthly maximum demand with a power-factor-only recalculation at 0.995. The bars remain almost identical; this is a calculated comparison. View the full-size graph.
The report therefore did not justify a substantial immediate demand-charge saving from power-factor correction alone. Potential benefits from released capacity, lower internal current and improved source control needed to be assessed separately.
Monthly maximum demand captures the highest billing intervals. The 30-minute data shows the changing power factor and reactive-power requirement across normal operation.

The original 30-minute records show how municipal reactive-power import and power factor varied from January to August 2026. View the full-size graph.
ENGINEERING STUDY / 02
Across five anonymised load centres, reported median power factors ranged from approximately 0.66 to 0.95. The weakest centre became the first local investigation priority, with other centres following according to their recorded conditions.

Project-derived power-factor statistics with anonymised load-centre names. The lower percentile describes weaker operating conditions; it is not the absolute minimum. View the full-size diagram.
Location mattered. Correction at the utility connection changes what that meter sees. Appropriately designed local correction can also reduce reactive current carried by internal feeders and transformers. It needs to be coordinated with the loads and protection at that location.
ENGINEERING STUDY / 03
Zamori examined how often different reactive-power requirements occurred. The largest reported duties were brief, while lower duties recurred across a much greater share of the measurement period.

The supplied duration curve shows that peak reactive-power requirements were brief, while lower duties recurred over many more operating hours. View the full-size graph.
The preliminary approach combined automatic staged compensation for recurring duty with fast electronic reactive support for transitions and exceptional requirements. A permanently connected bank sized only for the largest value could be unsuitable when the load or source mix changed.
Final capacities and detuning requirements remained subject to the harmonic survey, local correction study and equipment data. The intended controls also needed to avoid excessive leading power factor during low-load conditions.
ENGINEERING STUDY / 04
In the reconstructed series, utility power factor was weaker while the generator supplied much of the active power. Reactive demand still had to be supplied somewhere in the system.

Utility power factor changes with generator operation. The comparison explains why reactive-power control must consider which sources are supplying the plant. View the full-size visual.
Changing the generator's power-factor setting alone could transfer reactive duty to the utility connection. Generator voltage regulation, correction controls and future solar and battery reactive support therefore needed a coordinated operating philosophy.
Where the utility connection has an apparent-power ceiling, that coordination can affect the useful active power available within it. The supplied PDF illustrates this at 800 kVA: useful active power increases from 600 kW at power factor 0.75 to about 796 kW at 0.995. This is a calculated capacity comparison, not a billing-savings forecast.
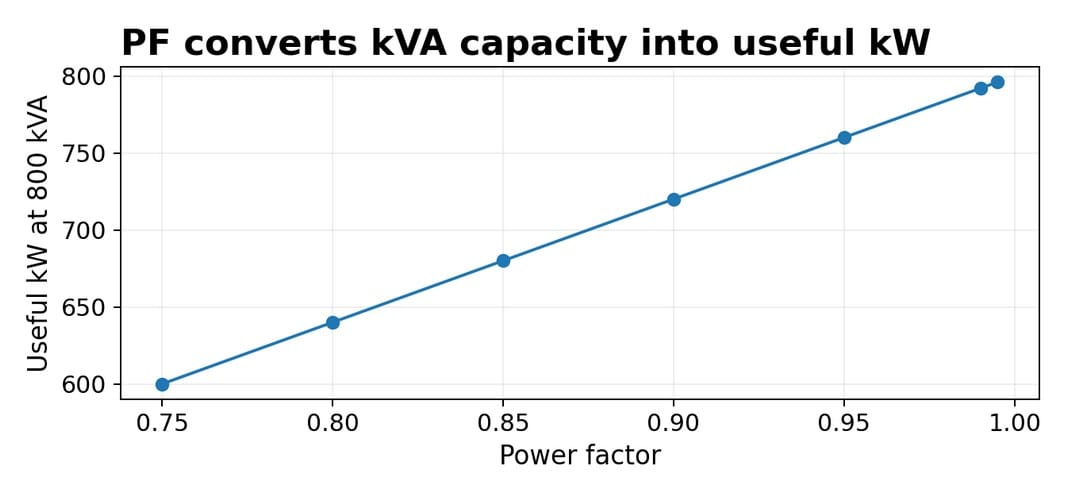
In the PDF’s 800 kVA example, improving power factor from 0.75 to 0.995 raises useful active-power capacity from 600 kW to about 796 kW. View the full-size visual.
Inverters and battery converters may contribute reactive support, but their available capability can fall as active-power output approaches their rating. Manufacturer capability data and the intended operating states had to be checked before crediting that support.
ENGINEERING STUDY / 05
The report identified the complete motor and variable-speed drive inventory as a design requirement. Motor duty, operating hours, starting methods and actual loading were needed alongside drive ratings and manufacturer data.
A drive may show good displacement power factor while harmonic currents still increase total current. The assessment therefore needed measured true power factor and harmonic information, rather than assuming one favourable power-factor reading resolved every condition.
Capacitor banks can interact with network impedance and drive harmonics. Detuning and filter requirements could only be finalised after those conditions were assessed. Drive-related energy savings also depended on the process duty, rather than following automatically from fitting a drive.
ENGINEERING STUDY / 06
The project report established investigation priorities and a preliminary correction approach. It identified the work required before procurement:
That gave the client a practical path from a low-power-factor observation to an engineered decision. The public case study makes no claim that the proposed equipment was installed or that a particular saving was achieved.
POWER QUALITY AND ELECTRICAL CAPACITY
Zamori can assess your power-factor records, electrical loads, generator operation and plans for solar or battery integration, then identify the measurements and design work needed.
The wider industrial project, connecting energy supply, storage and distribution design.
A separate Zamori hospitality project coordinating solar, batteries and generators.
Publication basis: Zamori's real industrial power-factor assessment and the supplied report graphs. Client names, site locations, account and meter numbers are withheld. Study data and calculated comparisons are distinguished from commissioned results. The cover photograph is illustrative.